Budgeting
A plan the business can be run against
A budget built bottom-up from how the business actually operates, so it’s something the team can steer by rather than a document filed in January.
Finance is how leadership maintains control. Most growing businesses are financially blind — we give you the budgets, visibility and reporting to make smart calls fast.
Proven success


Included services
A clear P&L, payment reconciliation and sales reporting make the next decision easier. These examples show the shape of the reporting, using fictional figures.

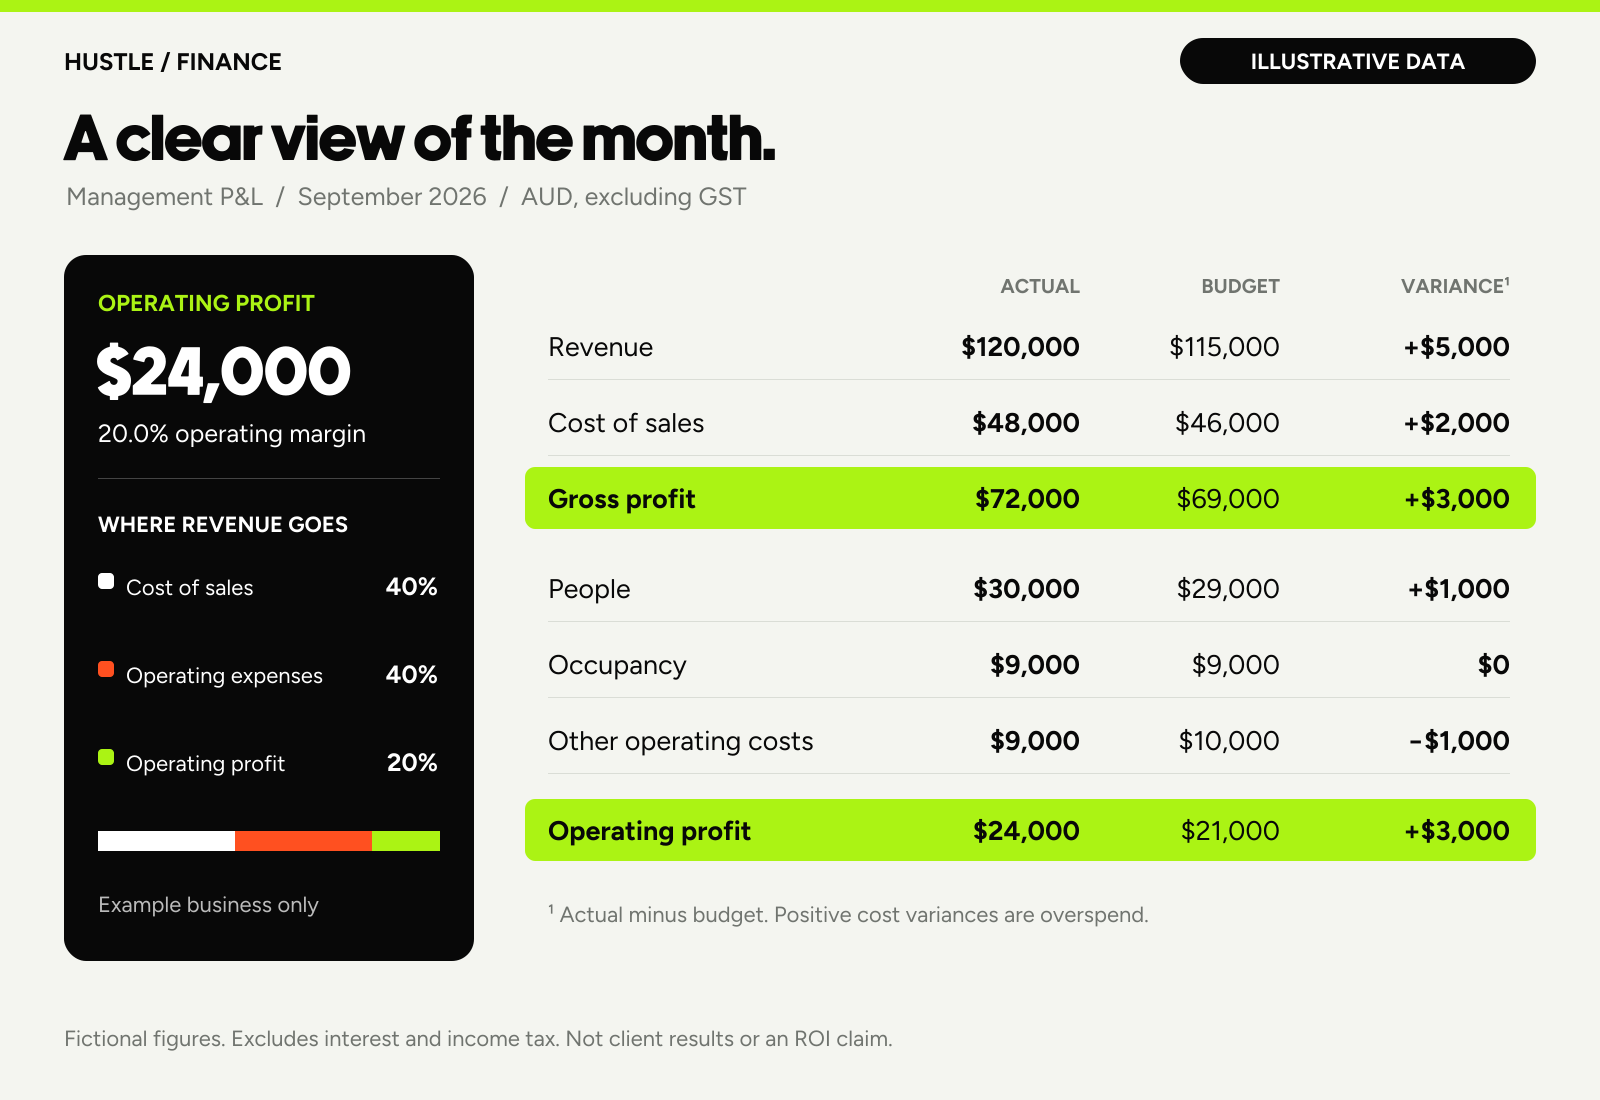
Revenue $120,000; cost of sales $48,000; gross profit $72,000; operating expenses $48,000; operating profit $24,000. Budget operating profit $21,000. Operating margin 20%. Excludes GST, interest and income tax.
| Line | Actual | Budget |
|---|---|---|
| Revenue | $120,000 | $115,000 |
| Cost of sales | $48,000 | $46,000 |
| Gross profit | $72,000 | $69,000 |
| Operating expenses | $48,000 | $48,000 |
| Operating profit | $24,000 | $21,000 |

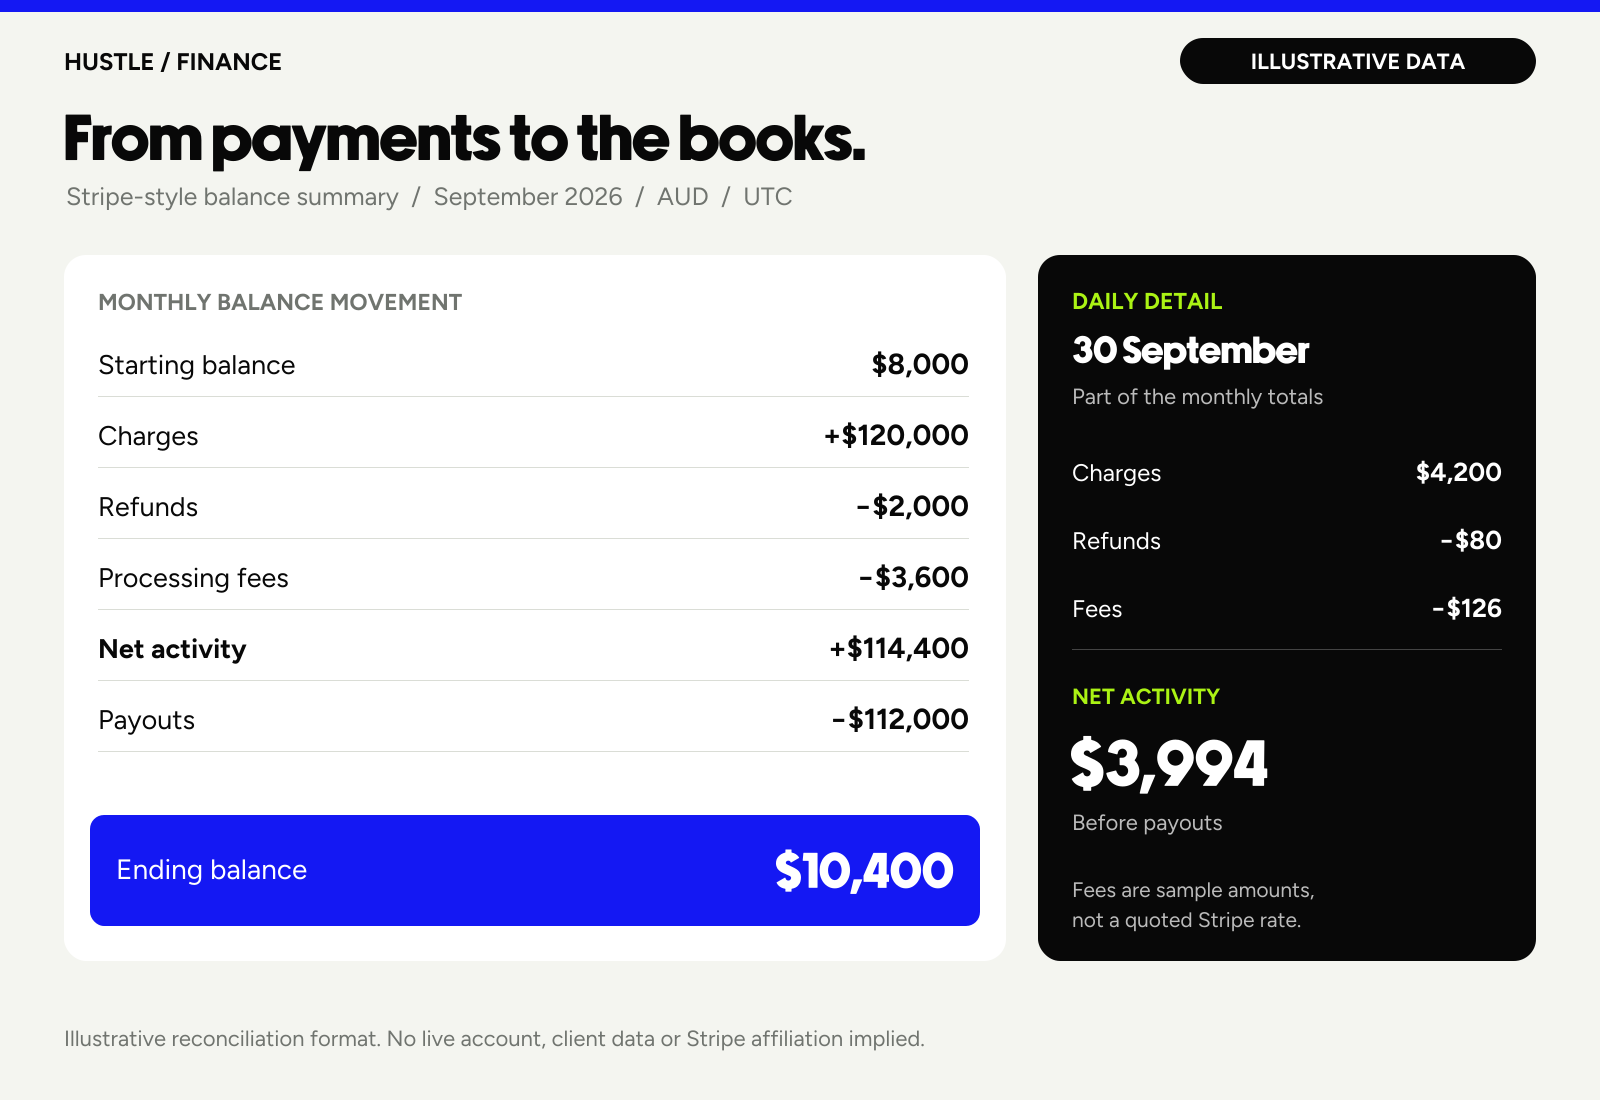
Starting balance $8,000 + charges $120,000 − refunds $2,000 − fees $3,600 − payouts $112,000 = ending balance $10,400. Daily subset for 30 September: charges $4,200 − refunds $80 − fees $126 = net activity $3,994 before payouts. Sample fee amounts are not a Stripe rate quote.
| Movement | Amount |
|---|---|
| Starting balance | $8,000 |
| Charges | $120,000 |
| Refunds | $2,000 |
| Fees | $3,600 |
| Net activity | $114,400 |
| Payouts | $112,000 |
| Ending balance | $10,400 |

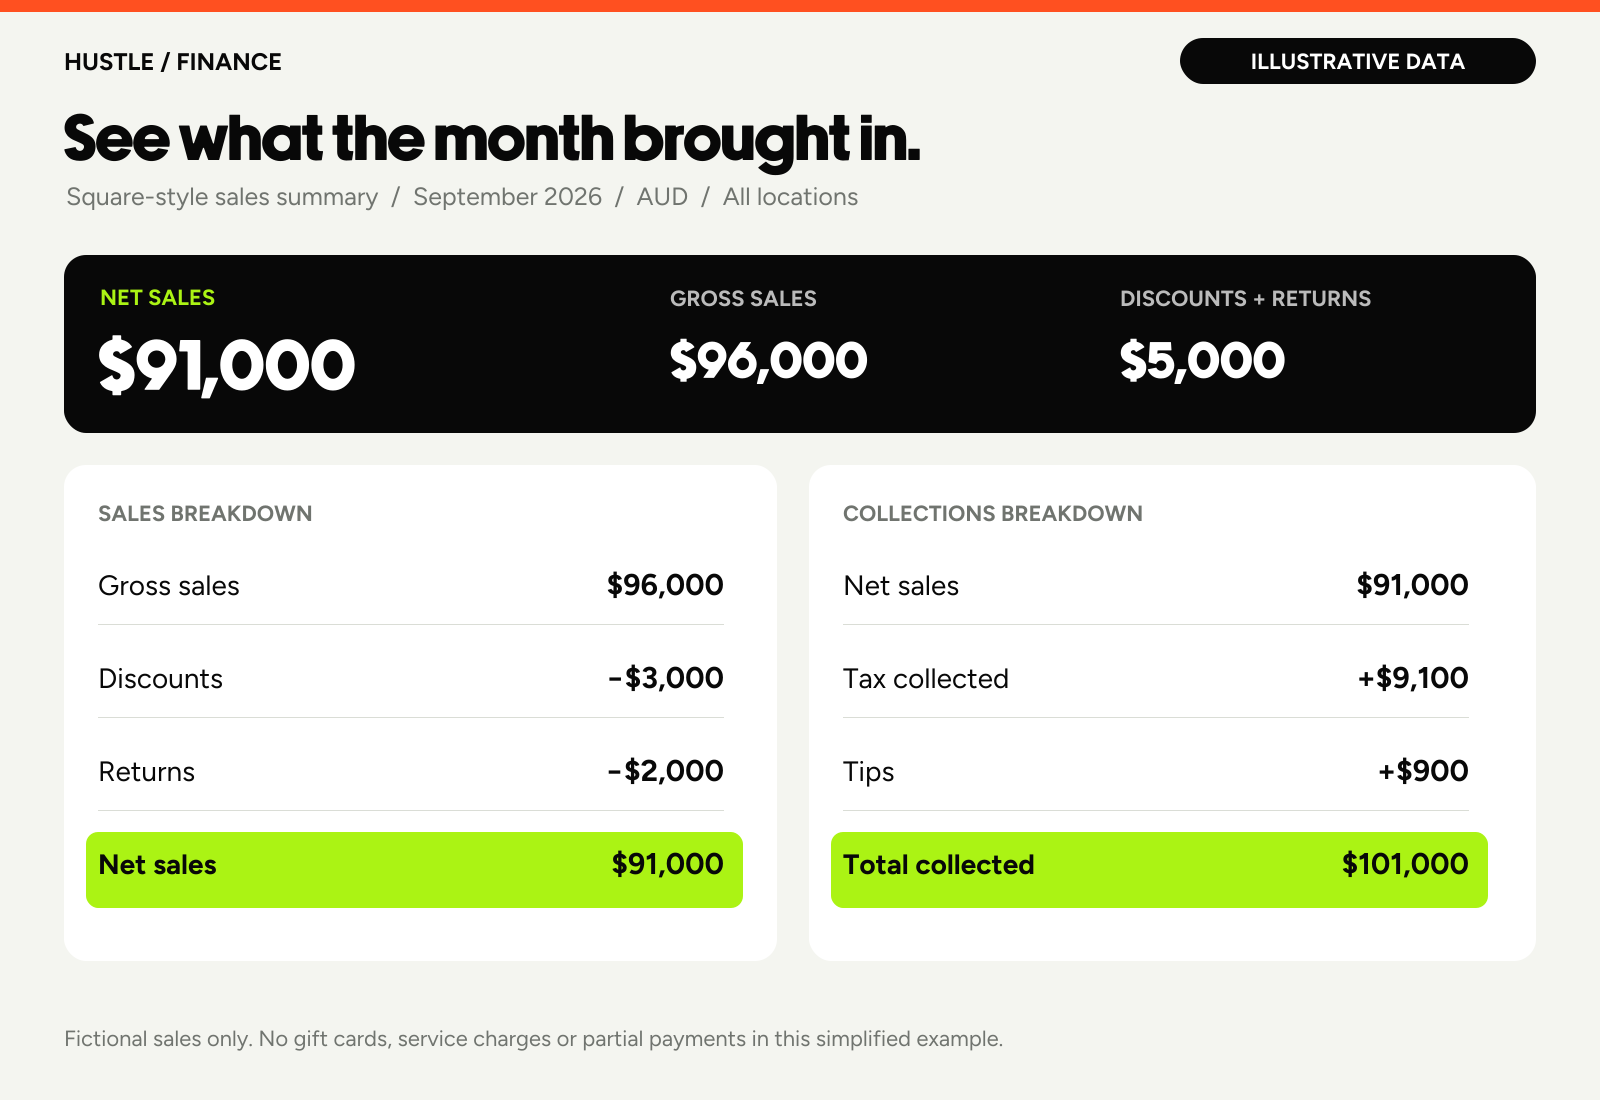
Gross sales $96,000 − discounts $3,000 − returns $2,000 = net sales $91,000. Net sales $91,000 + tax $9,100 + tips $900 = total collected $101,000. No gift cards, service charges or partial payments in this example.
| Line | Amount |
|---|---|
| Gross sales | $96,000 |
| Discounts | $3,000 |
| Returns | $2,000 |
| Net sales | $91,000 |
| Tax | $9,100 |
| Tips | $900 |
| Total collected | $101,000 |
Illustrative data only. These are custom reporting examples, not client results or live Stripe or Square accounts.
Finance is Step 4. It’s the part that tells you whether the rest of the engine is actually working. Without it, growth is just a slow-motion car crash.
With it, every decision upstream gets sharper. You know your cost per acquisition, your margin by line, and what happens if revenue dips.
We get the real numbers in one place: P&L, payments, sales and spend, cleaned up so everyone's looking at the same truth.
A budget built bottom-up from how the business actually operates, with spend categories and margin targets by line.
Actual vs budget, by line, on a regular rhythm — weekly where it matters — while there's still time to act.
Every budget line gets an owner who can see their own numbers in real time and is expected to explain them.
Scenario modelling and commercial decision support for pricing, hiring, expansion and investment calls.


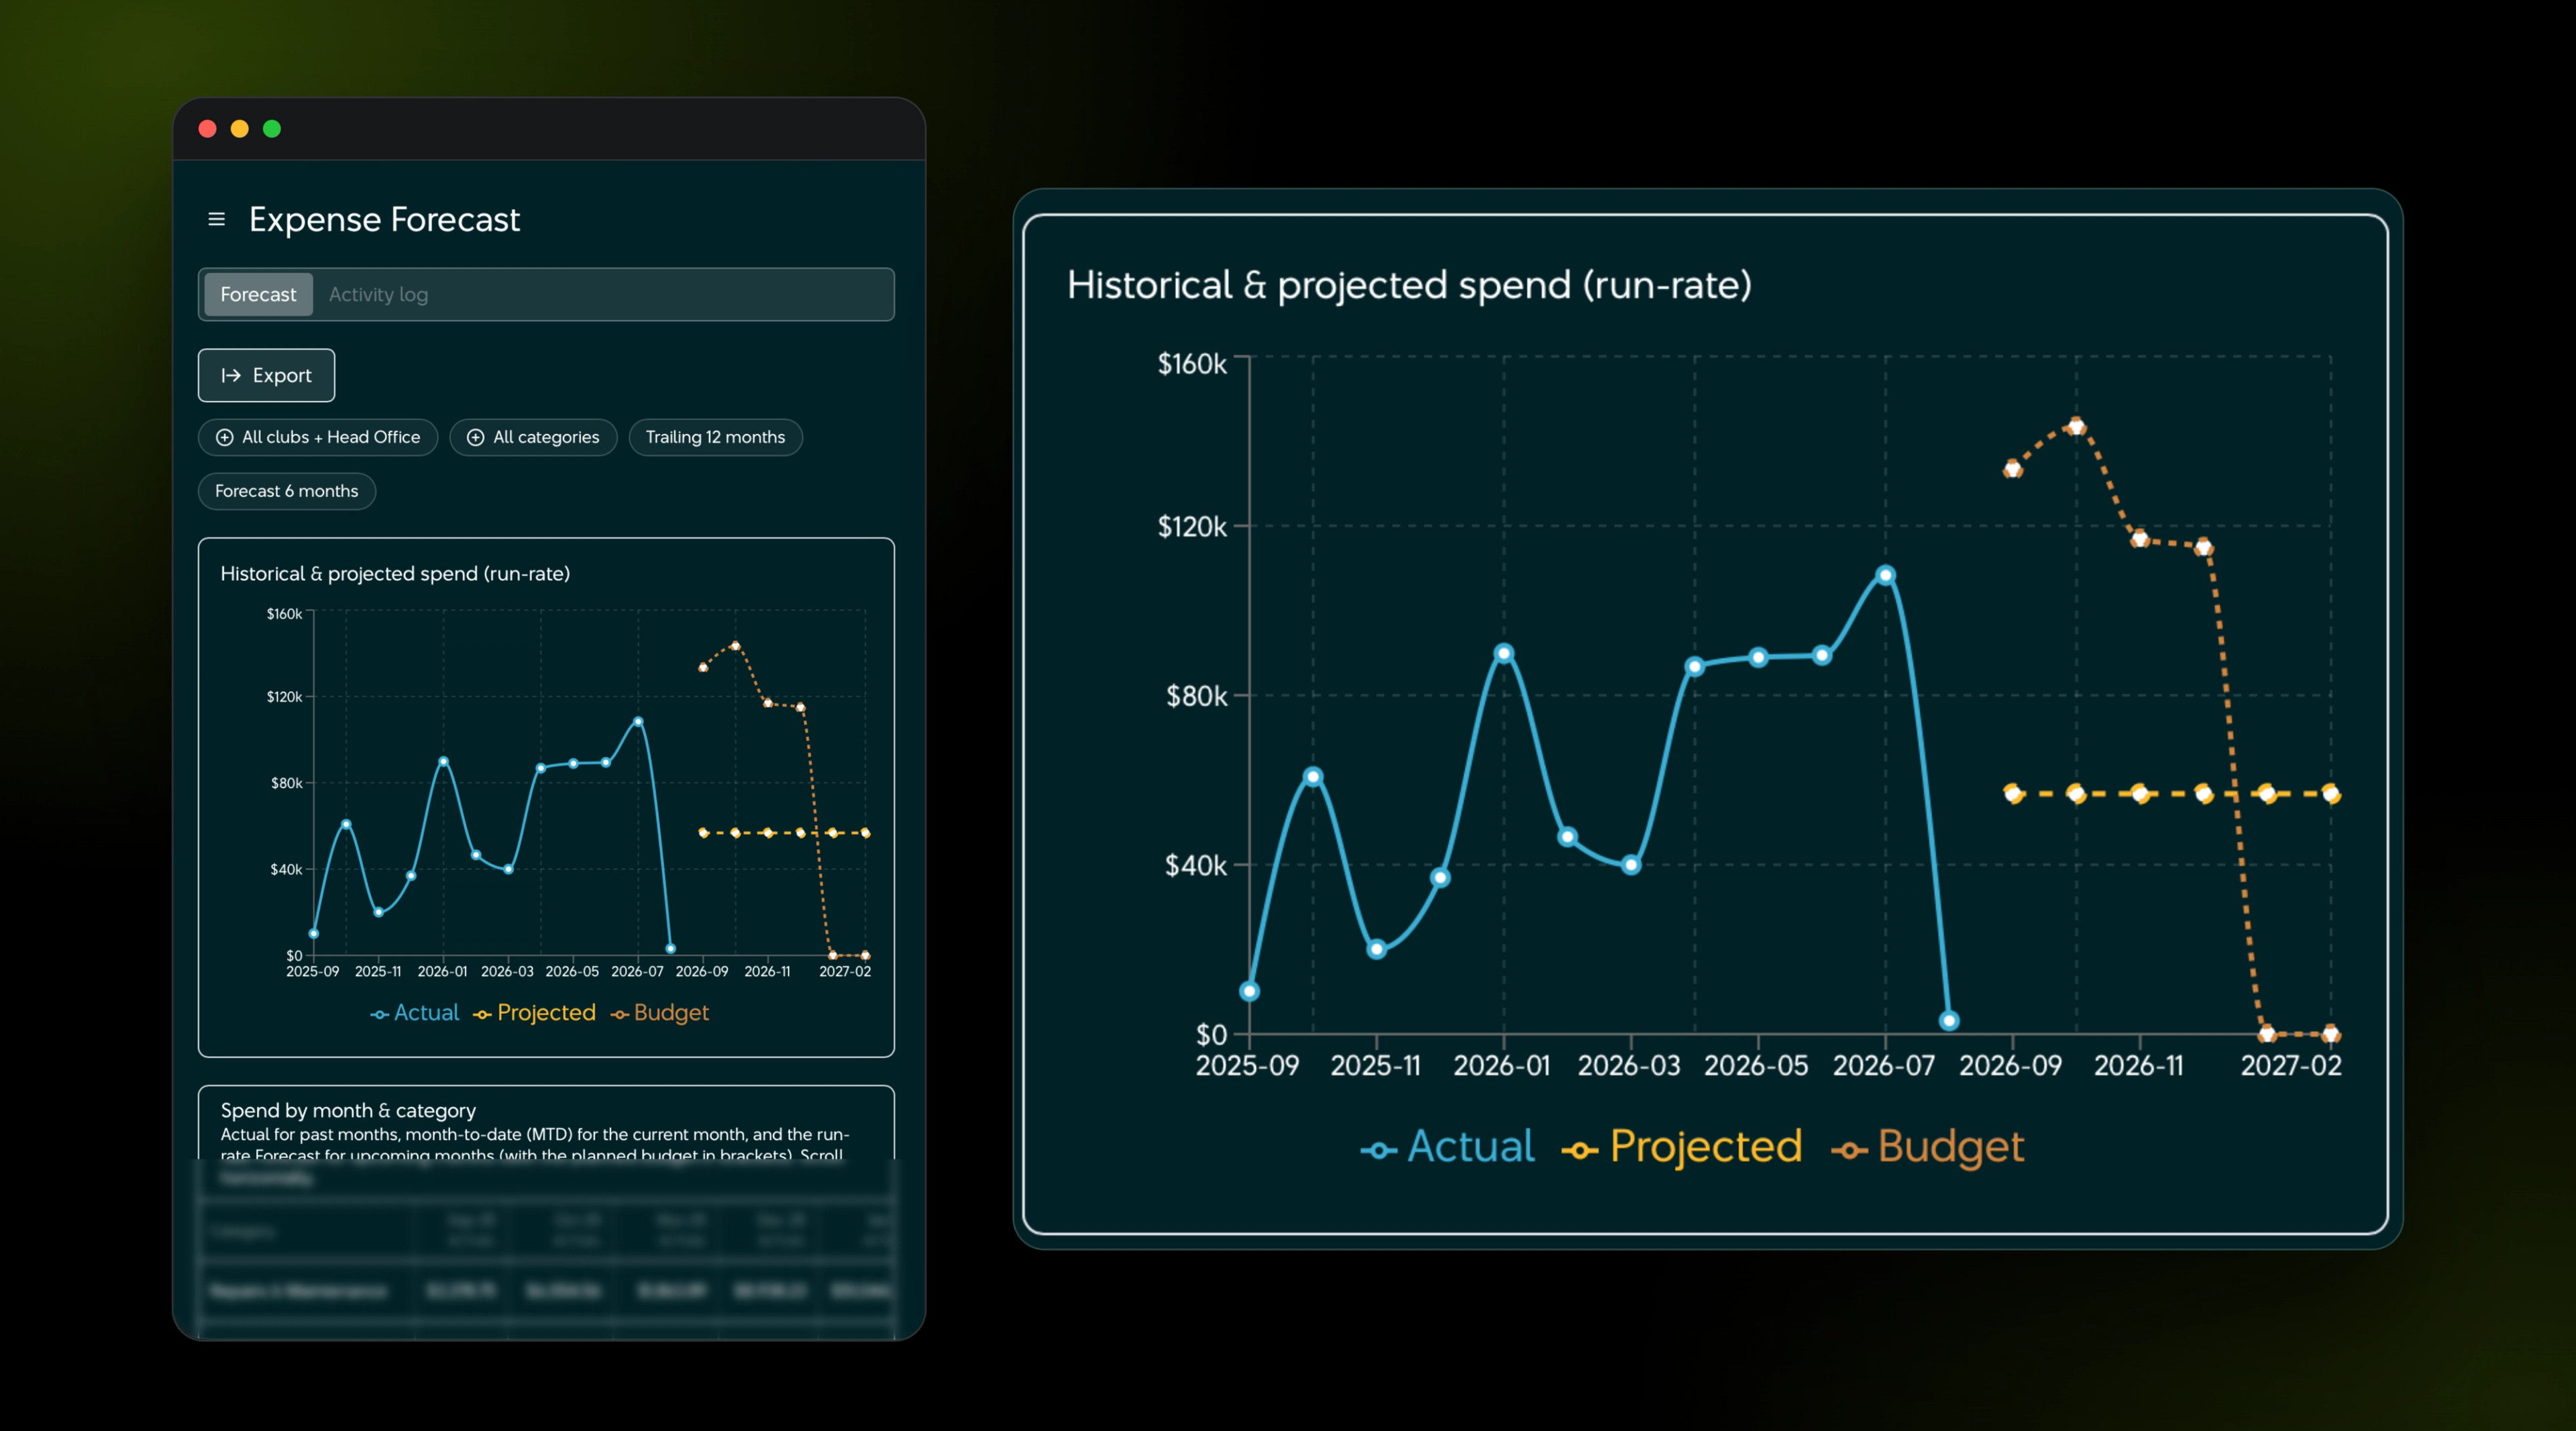
We track everything inside the same tech stack, so every owner and team lead can see exactly where they sit against budget in real time. That visibility is part of what is taking the business from losing money toward a clear path to $1M in profit and a second store in a premium location.

This is one part of the engine. The real value comes when it's connected to the rest: product, sales, operations, and finance working together. Let's map out which parts your business needs first.
We're a 100% local team, based in Rozelle, Sydney

We built Azura Financial's WordPress website, including broker profile pages and interactive tools like a Home Loan Health Check and a funding calculator that capture enquiries and route them to the right broker. Since handover we've kept improving it: a calculator rework, new SMSF and commercial lending pop-ups, and a move to faster managed hosting.